Since the introduction of Machine Learning and Deep Learning in Computer Vision, it’s tempting to use these statistical tools all the time. If our only tool is a hammer, every problem looks like a nail. Simpler, rules-based image processing techniques still have their place and can lead to a working solution faster in certain scenarios. In this article we’ll demonstrate how to detect bottle fill level from a poorly illuminated image with only 50 lines of Python.
We start by importing OpenCV’s Python bindings, Matplotlib and the imutils package which provides convenience functions for image processing.
import cv2
from matplotlib import pyplot as plt
import imutils
The images were taken with a monochrome camera but saved as three channel .png files. Only a single channel of the .png is used for processing as all three channels are identical. The three channel image is however retained for visualization purposes later. On inspection of the image we can observe the poor contrast throughout the image and reflective patches along one of the bottle edges.
# read image and take first channel only
bottle_3_channel = cv2.imread("./images/bottle_1.png")
bottle_gray = cv2.split(bottle_3_channel)[0]
cv2.imshow("Bottle Gray", bottle_gray)
cv2.waitKey(0)
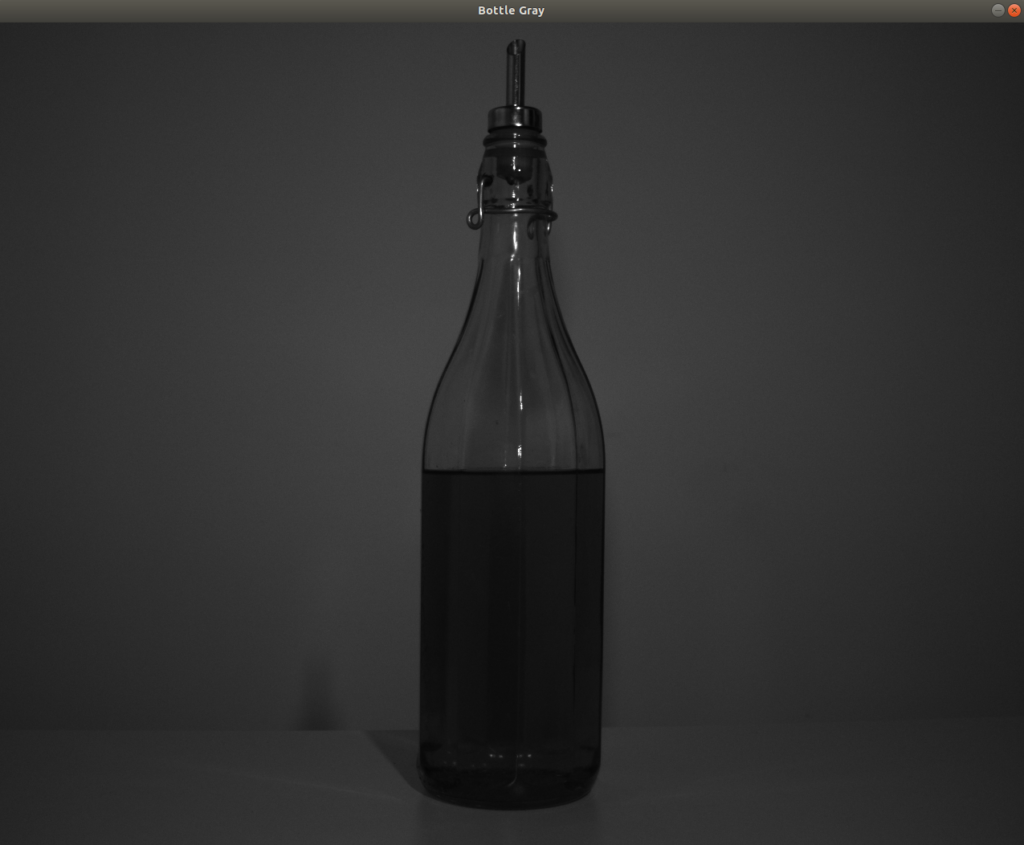
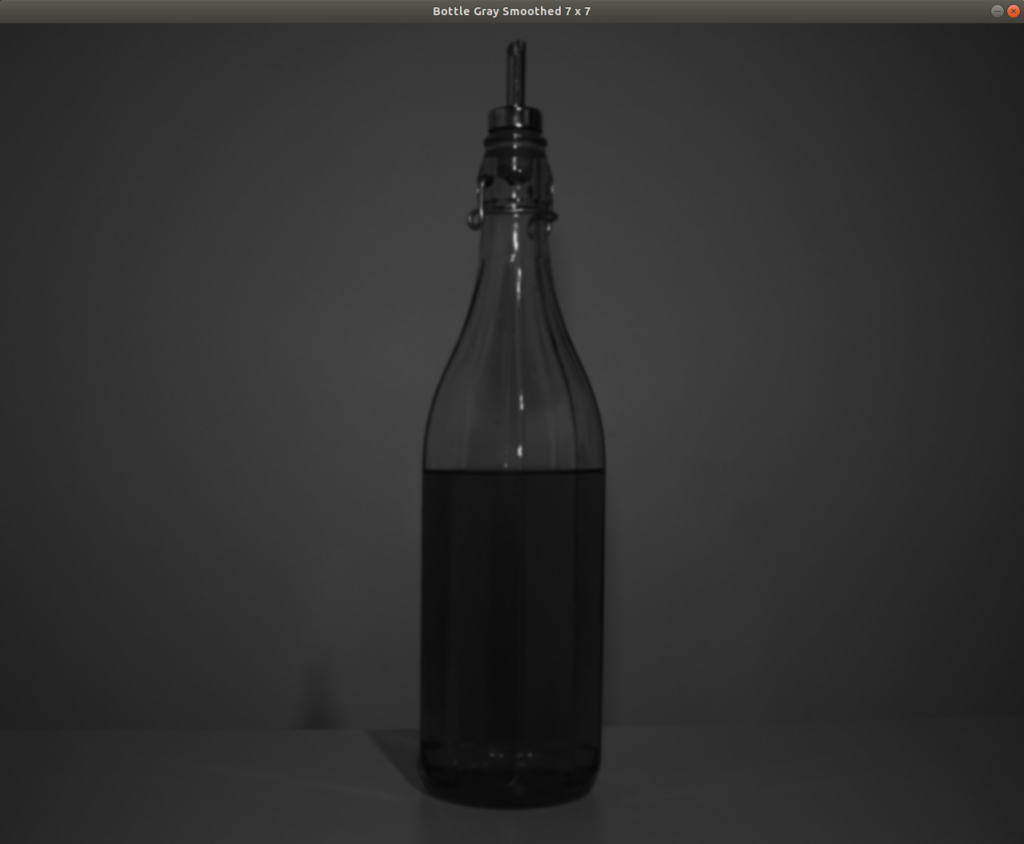
The image is firstly smoothed using a 7 x 7 pixel Gaussian kernel. This operation is performed as a preparation step prior to thresholding. It removes noise but retains the underlying structure of the image.
# blur image
bottle_gray = cv2.GaussianBlur(bottle_gray, (7, 7), 0)
cv2.imshow("Bottle Gray Smoothed 7 x 7", bottle_gray)
cv2.waitKey(0)
The image histogram is plotted to help identify a suitable threshold for segmenting the liquid in the bottle from the rest of the image. The poor contrast is apparent in the histogram – the peaks are close together without a clear, zero-intensity break in the trough. The small peak at lower intensity levels represents the liquid in the bottle.
# draw histogram
plt.hist(bottle_gray.ravel(), 256,[0, 256]); plt.show()

A global threshold of 27.5 was manually picked from the histogram above and an inverted binary image was created using OpenCV’s threshold() function.
# manual threshold
(T, bottle_threshold) = cv2.threshold(bottle_gray, 27.5, 255, cv2.THRESH_BINARY_INV)
cv2.imshow("Bottle Gray Threshold 27.5", bottle_threshold)
cv2.waitKey(0)
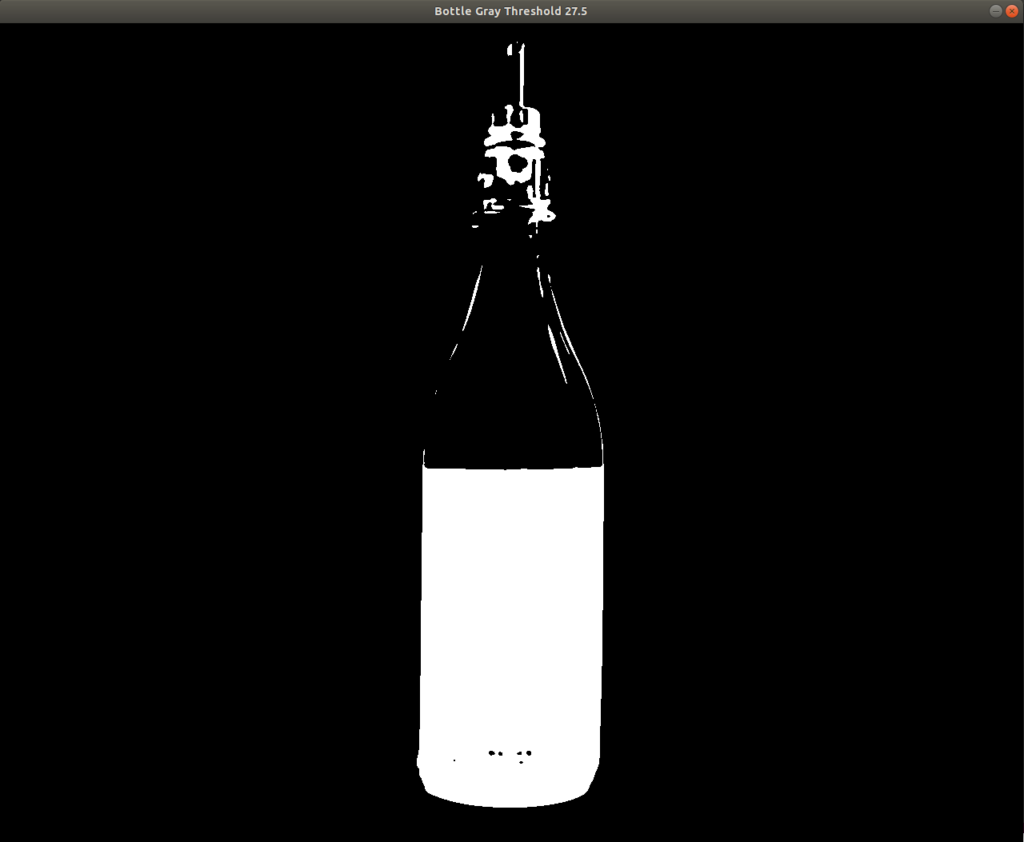
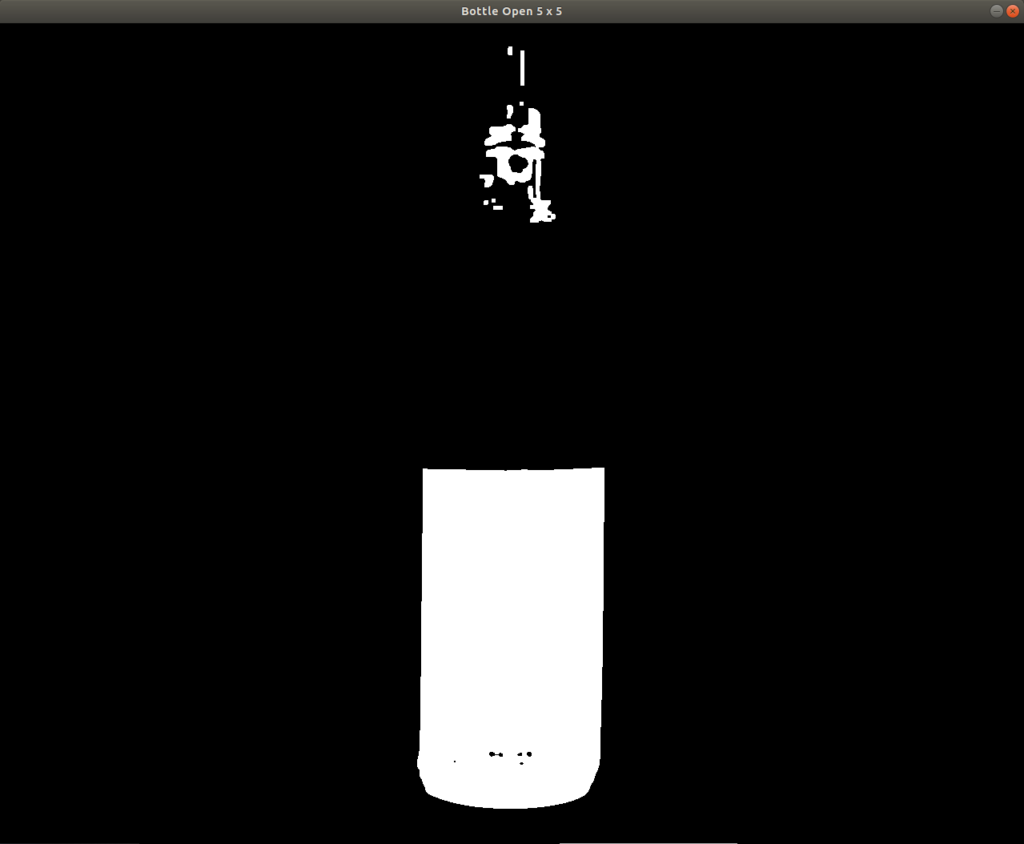
The binary image resulting from the thresholding operation nicely captures the liquid but also picks up parts of the metal bottle top and the lesser illuminated portions of the glass. The troublesome areas are the white connections leading up from both corners of the liquid surface, which will prevent clean segmentation of the liquid. A morphological opening operation will fix this. Opening firstly erodes the foreground image, removing connections and protruding edges, then dilates to restore the larger foreground objects. The code and image below demonstrate an opening operation with a 5 x 5 pixel kernel. The resulting image still contains parts of the upper bottle but the liquid is cleanly segmented.
# apply opening operation
kernel = cv2.getStructuringElement(cv2.MORPH_RECT, (5, 5))
bottle_open = cv2.morphologyEx(bottle_threshold, cv2.MORPH_OPEN, kernel)
cv2.imshow("Bottle Open 5 x 5", bottle_open)
cv2.waitKey(0)
To fully isolate the liquid, we start by using OpenCV’s findContours() function to identify all foreground shapes. The return type of the findContours() function depends on the OpenCV version used therefore the imutils grab_contours() function is applied to make the code OpenCV version-agnostic. The resulting image contains one large contour around the liquid with a number of small contours on the upper bottle.
# find all contours
contours = cv2.findContours(bottle_open.copy(), cv2.RETR_EXTERNAL, cv2.CHAIN_APPROX_SIMPLE)
contours = imutils.grab_contours(contours)
bottle_clone = bottle_3_channel.copy()
cv2.drawContours(bottle_clone, contours, -1, (255, 0, 0), 2)
cv2.imshow("All Contours", bottle_clone)
cv2.waitKey(0)
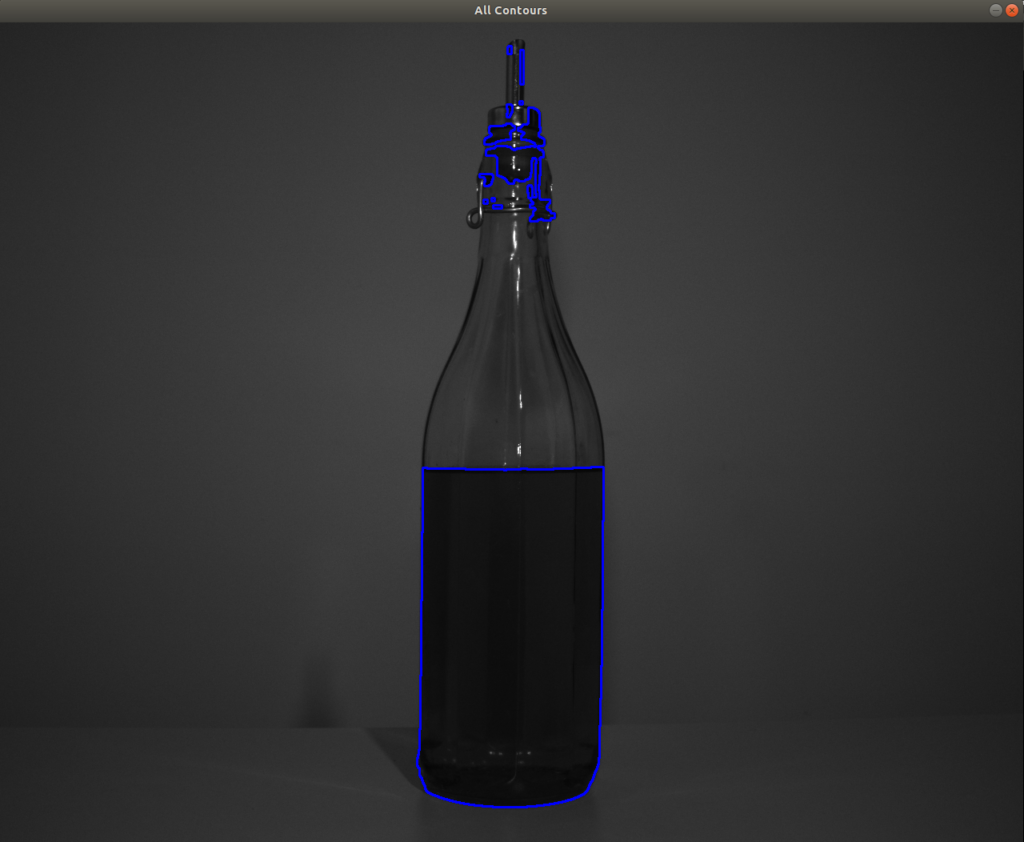
To identify the larger contour representing the liquid, the contours are sorted by contour area and the largest is printed over the original image, cleanly segmenting the liquid.
# sort contours by area
areas = [cv2.contourArea(contour) for contour in contours]
(contours, areas) = zip(*sorted(zip(contours, areas), key=lambda a:a[1]))
# print contour with largest area
bottle_clone = bottle_3_channel.copy()
cv2.drawContours(bottle_clone, [contours[-1]], -1, (255, 0, 0), 2)
cv2.imshow("Largest contour", bottle_clone)
cv2.waitKey(0)
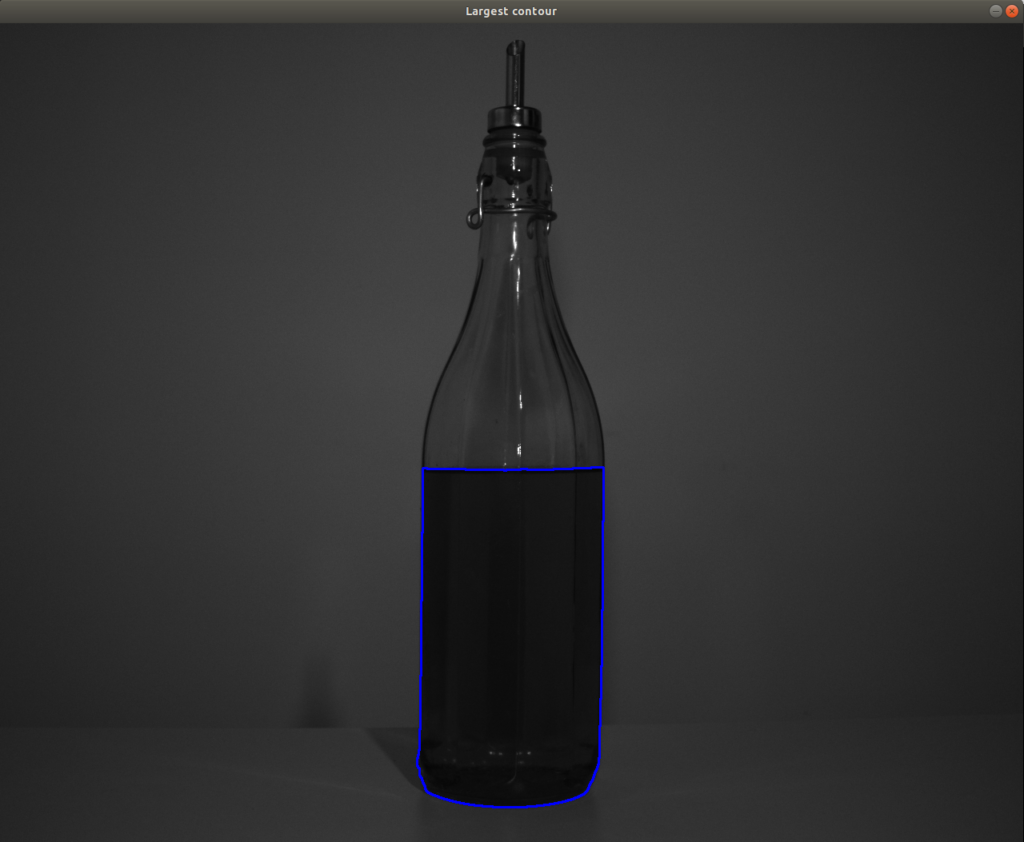
Having selected the correct contour, the next step is to draw a bounding box around the contour and calculate its aspect ratio (the ratio between the width and the height of the liquid in the bottle). The aspect ratio value can then be used to determine how full the bottle is and a threshold can be set to identify low liquid levels.
# draw bounding box, calculate aspect and display decision
bottle_clone = bottle_3_channel.copy()
(x, y, w, h) = cv2.boundingRect(contours[-1])
aspectRatio = w / float(h)
if aspectRatio < 0.4:
    cv2.rectangle(bottle_clone, (x, y), (x + w, y + h), (0, 255, 0), 2)
    cv2.putText(bottle_clone, "Full", (x + 10, y + 20), cv2.FONT_HERSHEY_PLAIN, 1, (0, 255, 0), 2)
else:
    cv2.rectangle(bottle_clone, (x, y), (x + w, y + h), (0, 0, 255), 2)
    cv2.putText(bottle_clone, "Low", (x + 10, y + 20), cv2.FONT_HERSHEY_PLAIN, 1, (0, 0, 255), 2)
cv2.imshow("Decision", bottle_clone)
cv2.waitKey(0)
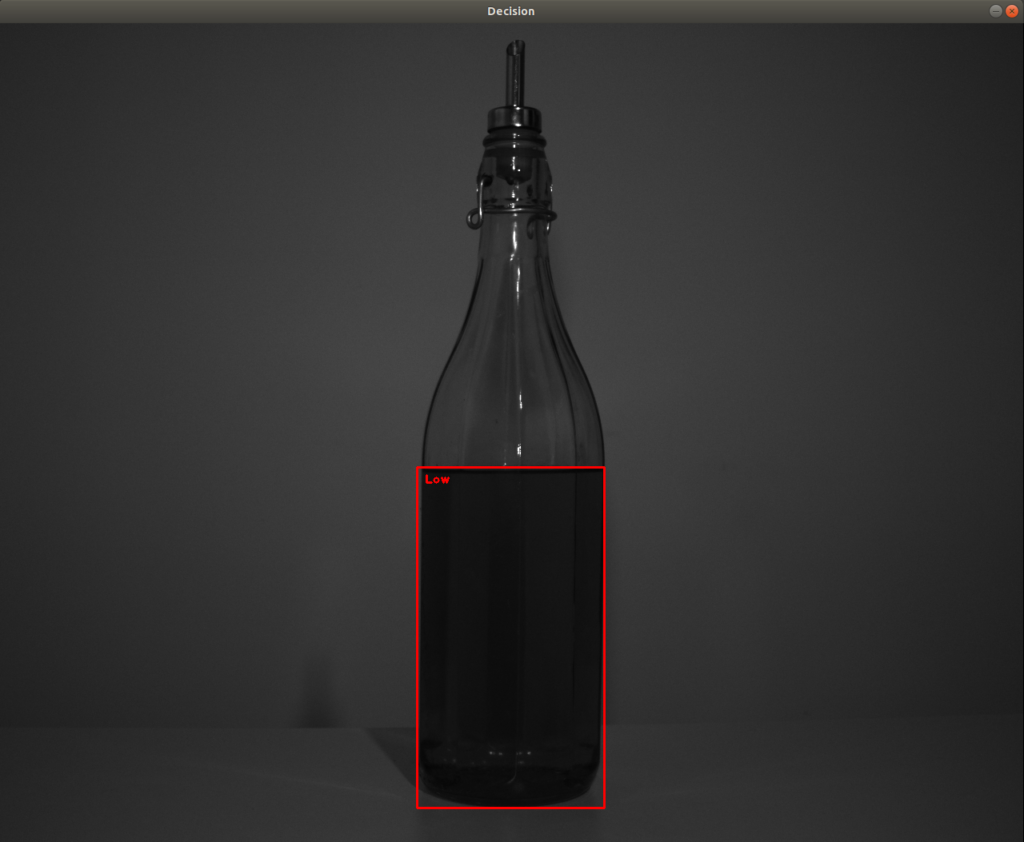
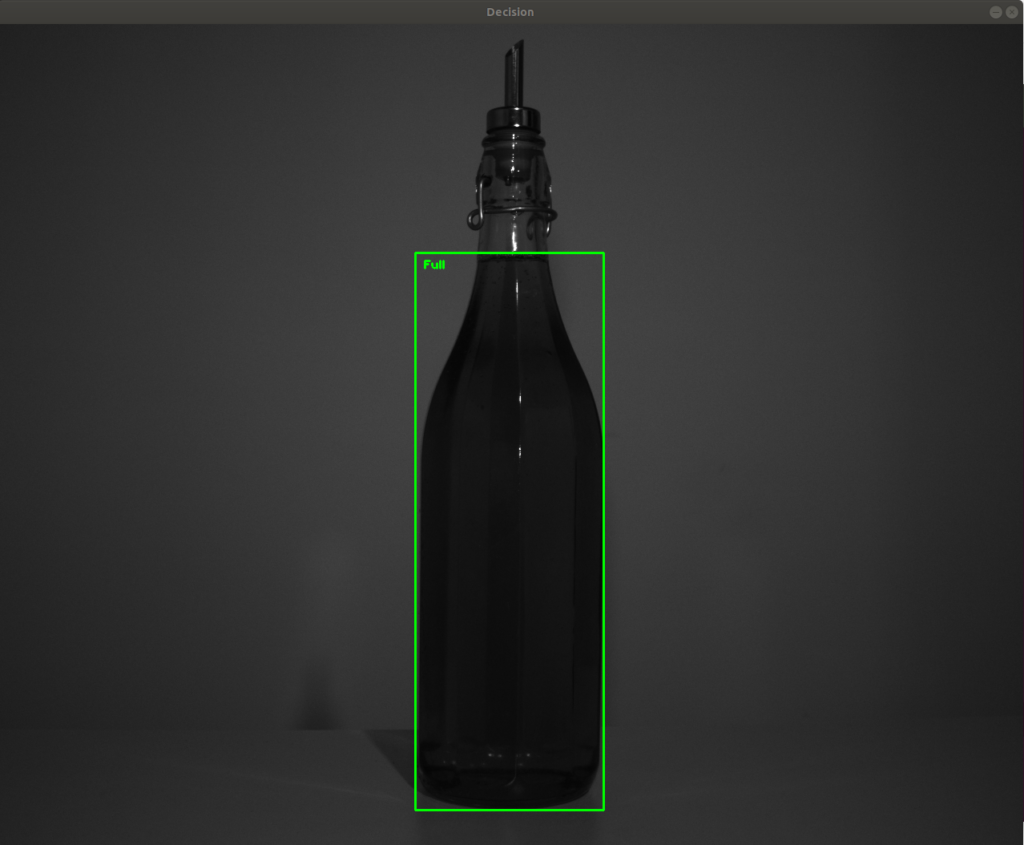
An image of a full bottle presented to the same code above yields a positive result based on the taller bounding box exceeding the aspect ratio threshold.
Conclusion
This article has demonstrated how bottle fill level can be determined and assessed using only 50 lines of Python. The input image was initially smoothed using a Gaussian kernel followed by thresholding, morphological opening and contouring. A bounding box was drawn around the largest contour and the aspect ratio calculated to indicate the fill level.
