
The Depth of Field (DOF) of a lens refers to its ability to maintain a required level of image quality, without refocusing, as the object position is adjusted closer to and further from the point of best focus. This is an especially important consideration when inspecting objects with complex three-dimensional geometries. This article explores the concept of Depth of Field and walks through an example using OpenCV.
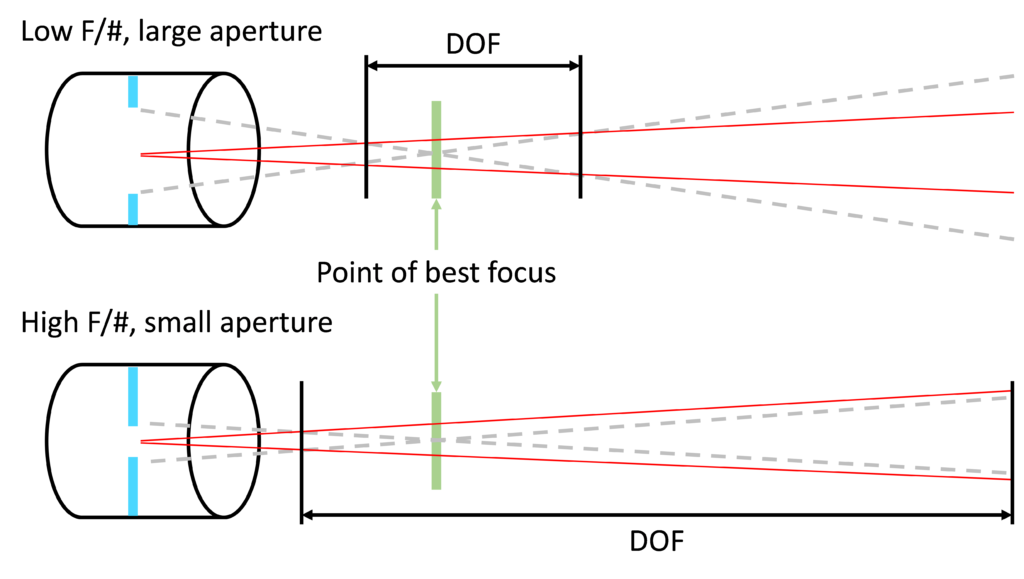
DOF is driven by the iris setting of the lens. As we close the lens aperture, increasing the F/#, we get better depth of field i.e. we maintain image quality over a greater distance from the point of best focus. The figure below illustrates this concept. The gray dashed lines show how the light spreads as it moves from the object to the lens. When an object moves away from the point of best focus, the object details move into a wider area of the gray cone, blurring the object details with the other information around it. The red cone represents the resolution of the system. The points at which the red cone and the gray cone intersect represent the DOF.
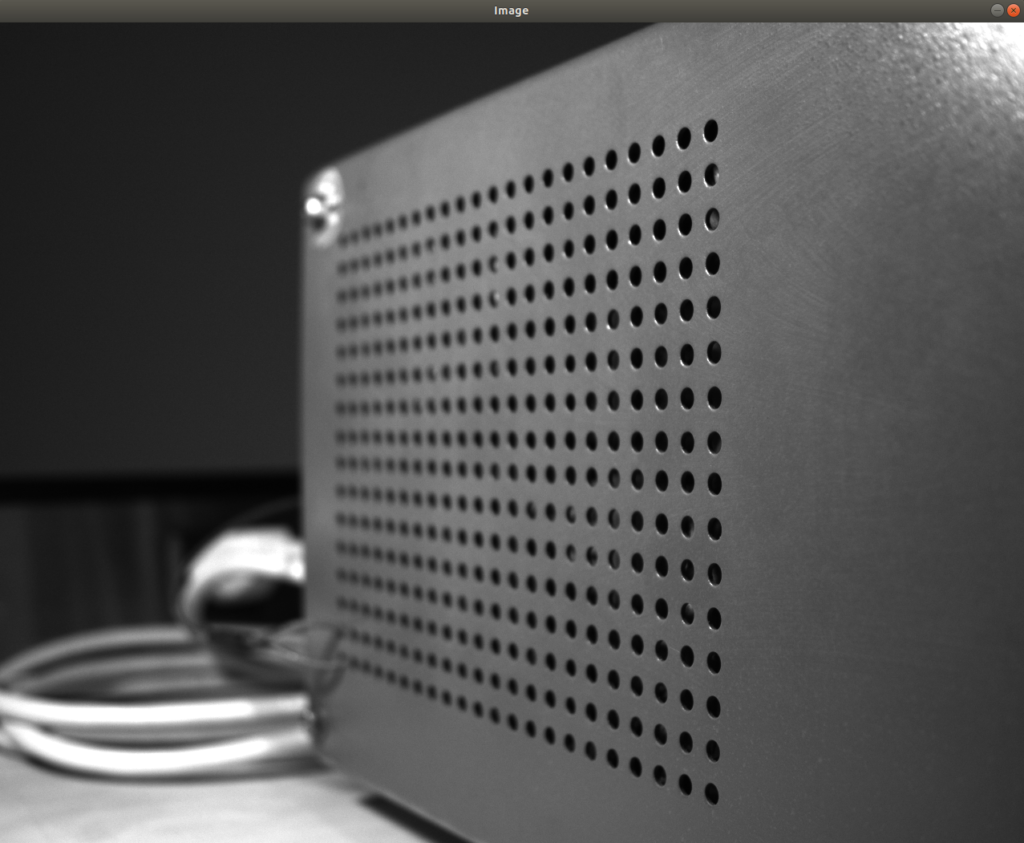
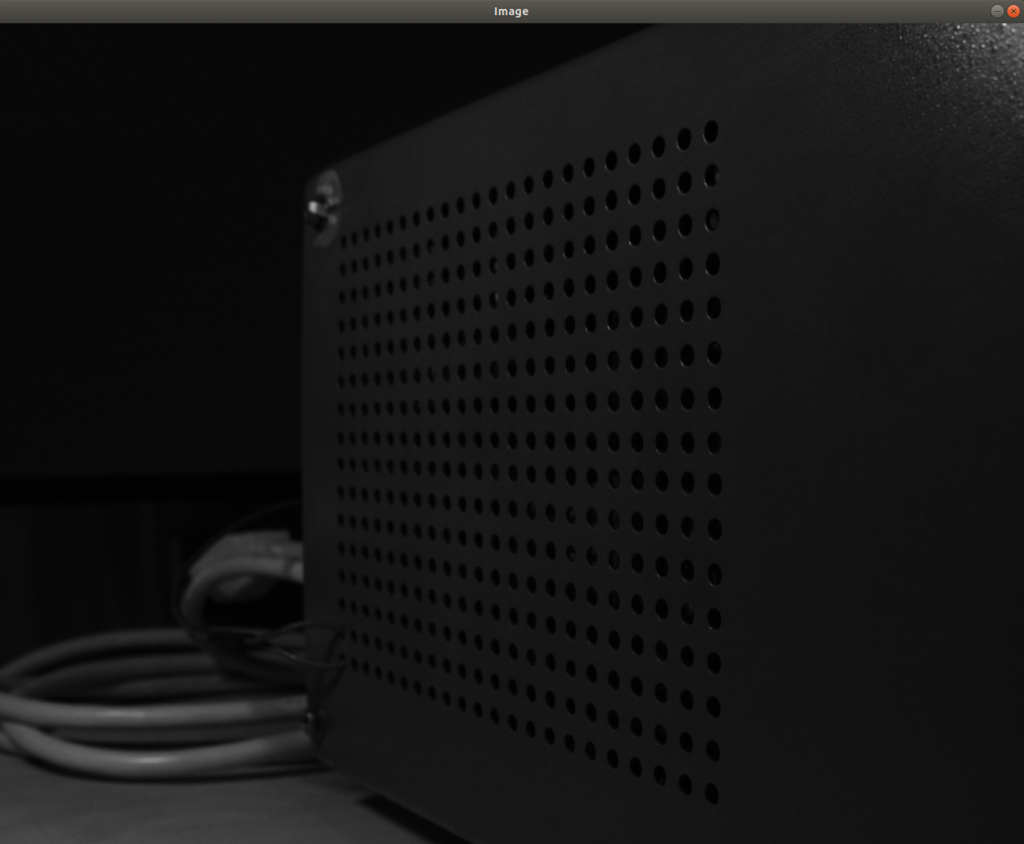
Let’s further illustrate this with an example. The Python code below starts with the usual imports and reads an image of a power supply housing, shot diagonally to create a makeshift target for DOF testing.
import cv2
from matplotlib import pyplot as plt
import imutils

# read image and take first channel only
image_3_channel = cv2.imread("./images/open.png")
image_gray = cv2.split(image_3_channel)[0]
cv2.imshow("Image", image_gray)
cv2.waitKey(0)
The image below was taken with the lens aperture fully open, giving a low F/# and low DOF. The point of best focus is the position of the holes on the right of the image, closest to the camera. The effect of low DOF can be seen as the holes quickly blur when distance increases from the point of best focus.
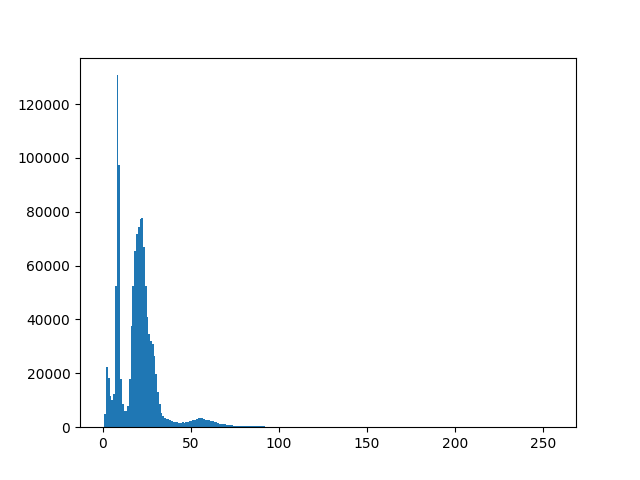
# draw histogram
plt.hist(image_gray.ravel(), 256,[0, 256]); plt.show()
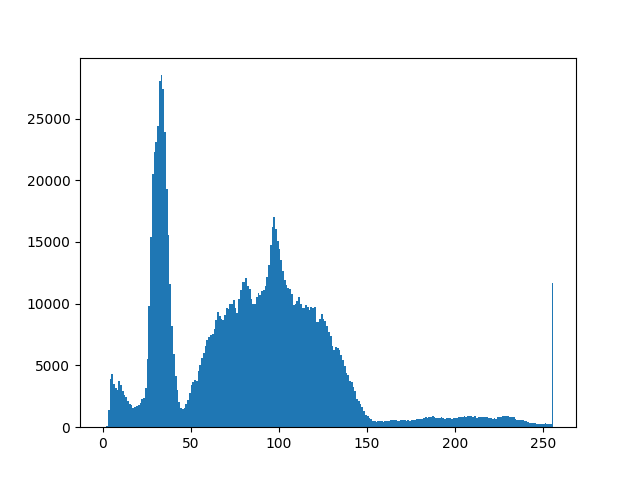
For comparison later, we’ll plot the histogram of the image with the aperture fully open. Note that the contrast is fairly good – the side of the power supply is clearly distinguishable from the rest of the image.
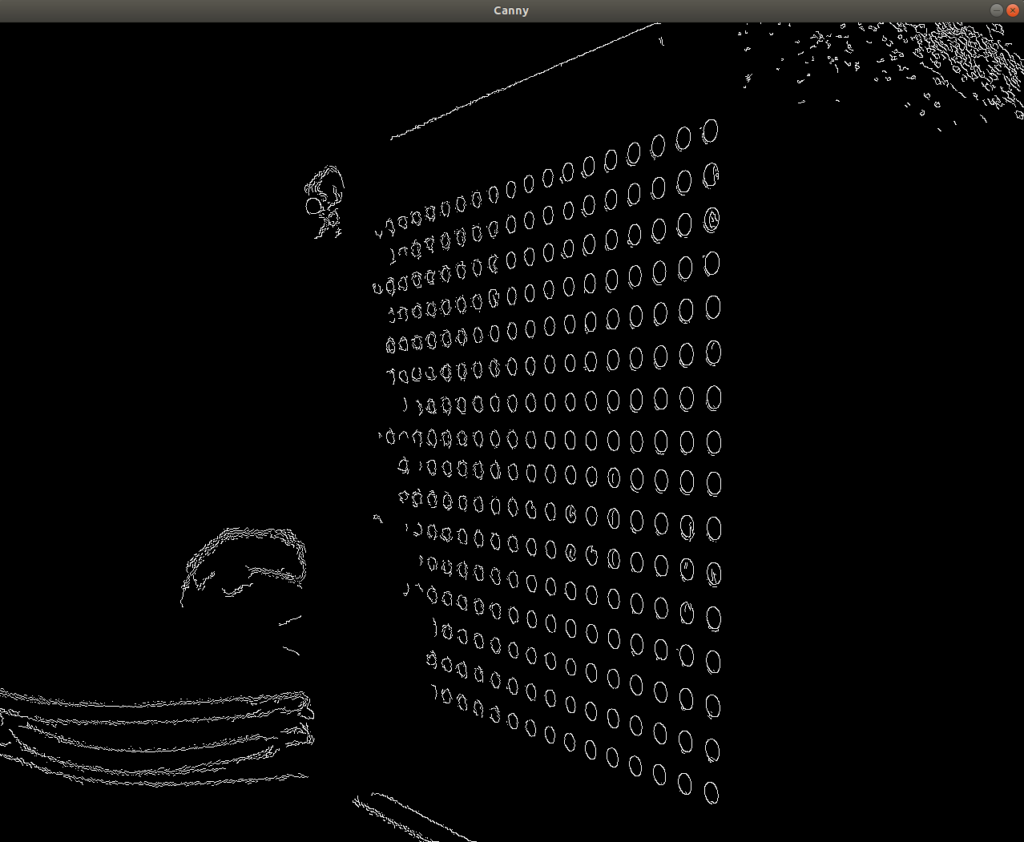
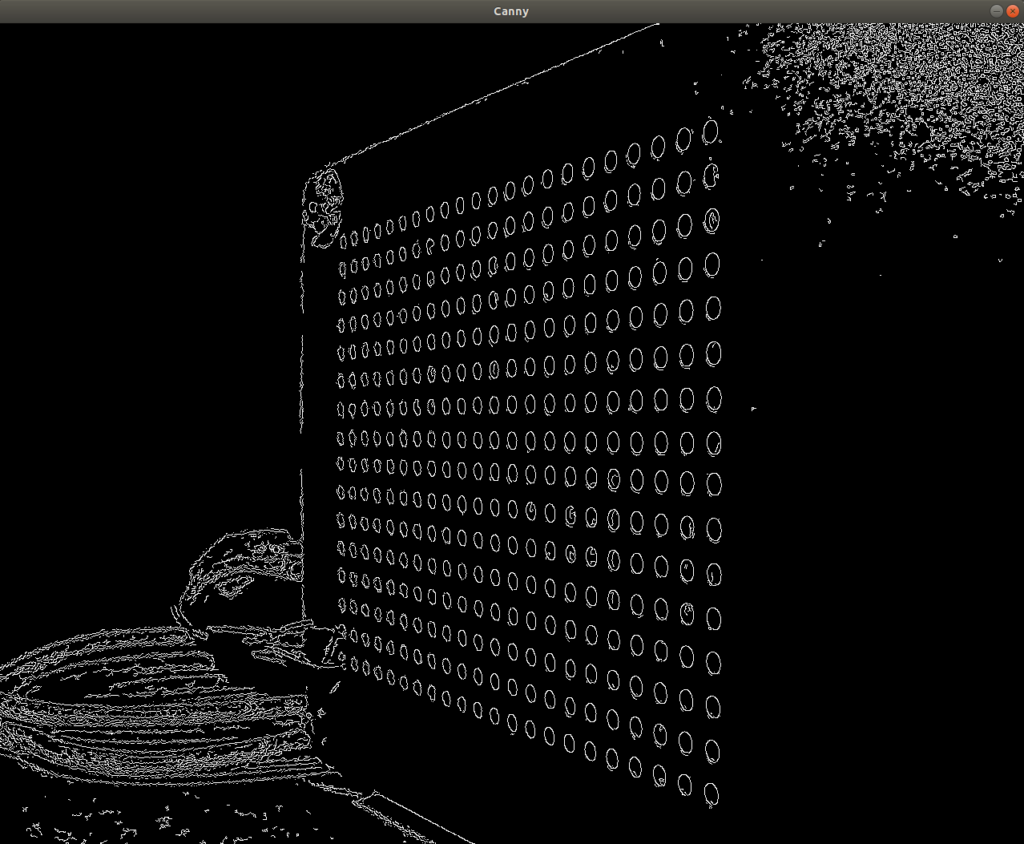
The drawback of low DOF can be illustrated by running a Canny edge detector over the image. The resulting image has very clear edges for the holes at the point of best focus but fails to detect the holes as distance from the point of best focus increases.
# apply Canny edge detection
canny = imutils.auto_canny(image_gray)

# show the edges
cv2.imshow("Canny", canny)
cv2.waitKey(0)
Let’s now retake the image with a small aperture, giving a high F/#. The image below was taken in the same lighting conditions as the low F/# image displayed at the beginning of this article. The holes furthest away from the point of best focus are visible, which is positive and shows the higher DOF, however the overall image contrast and brightness are considerably poorer.
The histogram below further illustrates the negative effect of closing the aperture. Less light makes its way into the lens and contrast deteriorates as we reach the diffraction limit of the lens.
Running a Canny edge detector over the small aperture, high F/# image further illustrates this effect. Edges are visible further away from the point of best focus however the overall quality of the edges across the whole image is poorer, even at the point of best focus, as a result of the deteriorated contrast.
Conclusion
This article has explored the concept of Depth of Field (DOF) and demonstrated how contrast can deteriorate as DOF increases. When selecting lenses and setting aperture size, it is important therefore to find the appropriate compromise between DOF and contrast. This is especially pertinent when inspecting three-dimensional objects with features at different depths.