
Last week we looked at how the simplest of Machine Learning models, Linear Regression, can be used to predict continuous values. Logistic Regression, the twin of Linear Regression, applies the same principles to a classification task. In this blog, we’ll demonstrate Logistic Regression by training and testing a binary classifier using Kaggle’s Heart Disease dataset.
Let’s first examine how Logistic Regression works. As with Linear Regression, Logistic Regression makes a prediction by calculating a weighted sum of the model’s input features, in addition to a constant which is often called the bias or intercept. Once the weighed sum of the input features is calculated, Logistic Regression outputs the logistic of this sum. The logistic is calculated using a sigmoid function which, for any input value, outputs a number between 0 and 1. For a given data instance provided to the model, if the sigmoid function output is greater than or equal to 0.5, the model predicts that the instance belongs to the positive class. Otherwise, the data instance is classified as negative.

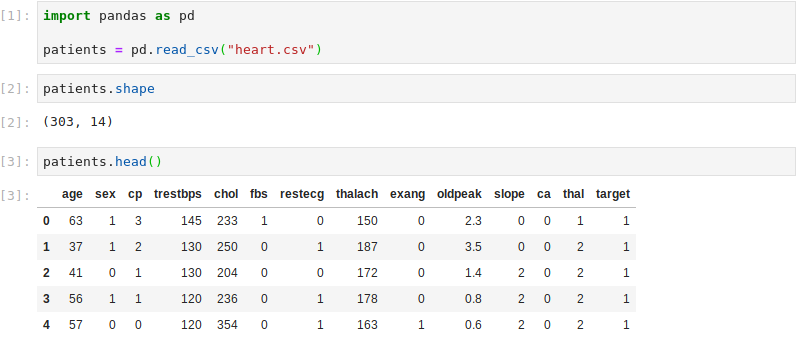
The dataset .csv file is read into a Pandas DataFrame. The dataset contains heart disease information for 303 patients. There are 13 features describing the patient and a target column indicating if the patient indeed has heart disease. The features capture information such as age, sex and cholesterol. A full description of the features can be found on Kaggle’s website.
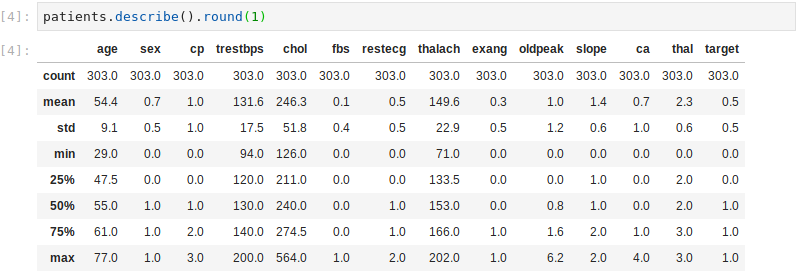
Using the Pandas describe() method, we can firstly observe that there are no missing values – the count number for all columns is 303, which matches the number of rows (patients). A second observation is that the sex is skewed. The mean of the sex feature is 0.7, indicating that the dataset contains more males than females.
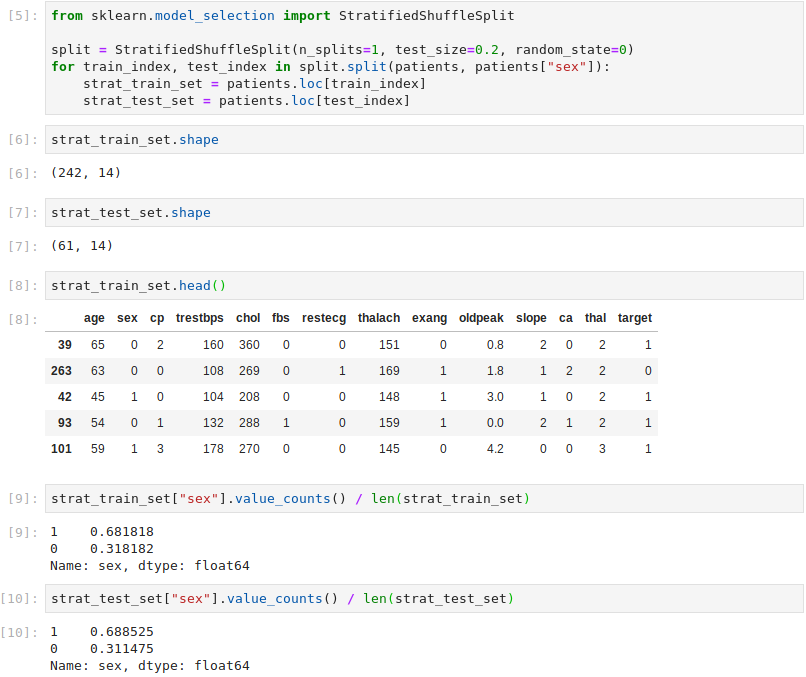
This considered, Scikit-Learn’s StratifiedShuffleSplit class is used to ensure that the training set and test set both contain equal proportions of males and females. This avoids training and testing with unbalanced datasets.
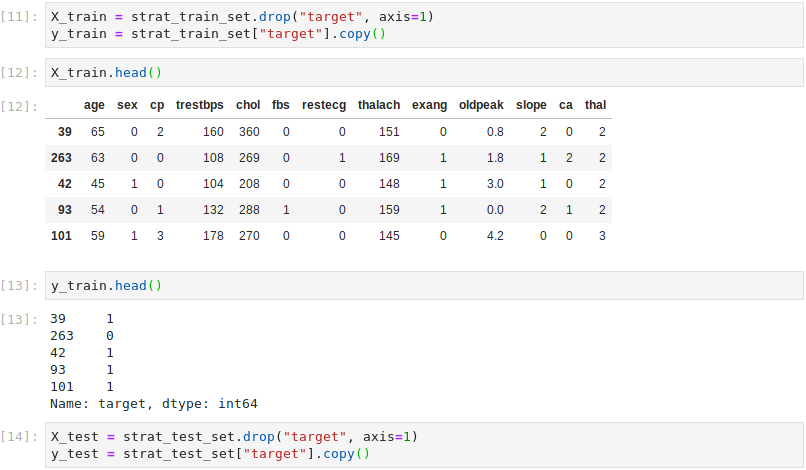
Having split the dataset into training and test sets, the features (X) and labels (y) are separated. It can be seen that the X_train DataFrame no longer contains the ‘target’ column.
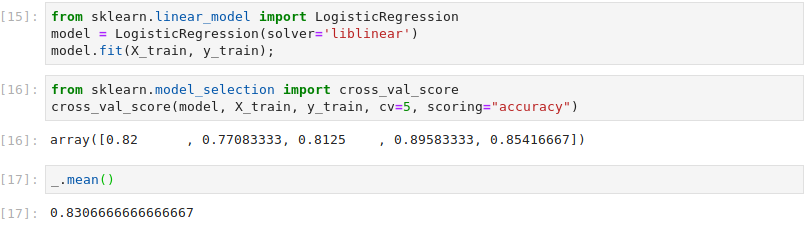
Scikit-Learn’s LogisticRegression class is instantiated and fit to the training data. Cross-validation is ran on the training data using 5 folds, giving a mean accuracy of 83% and a maximum accuracy of 90%.
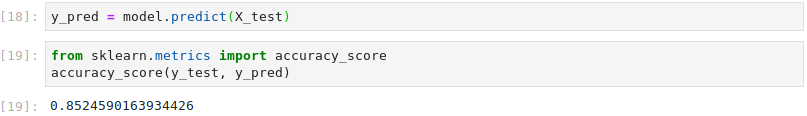
To test the trained model, we make predictions based on the test data and compute the accuracy. The test accuracy is slightly higher than the mean cross-validation accuracy although lower than the maximum cross-validation accuracy. This may be explained by the fact that the model used to make predictions based on the test set is trained on the full training dataset. When using cross-validation, each model is trained on a sub-set of of the training data and therefore has less information with which to make predictions.
In conclusion, we’ve seen how regression techniques can be applied to classification problems using Logistic Regression. As with Linear Regression, despite its simplicity, Logistic Regression remains a useful tool for establishing an accuracy baseline before exploring more advanced models.