
The most common metric for evaluating visual inspection system performance is accuracy, defined as the percentage of inspected objects correctly classified. Evaluating a system on accuracy alone can be highly misleading, especially when using skewed data sets to train and evaluate the classifier. This article highlights the main issue associated with accuracy as an evaluation metric and reviews alternatives.
Accuracy and the confusion matrix
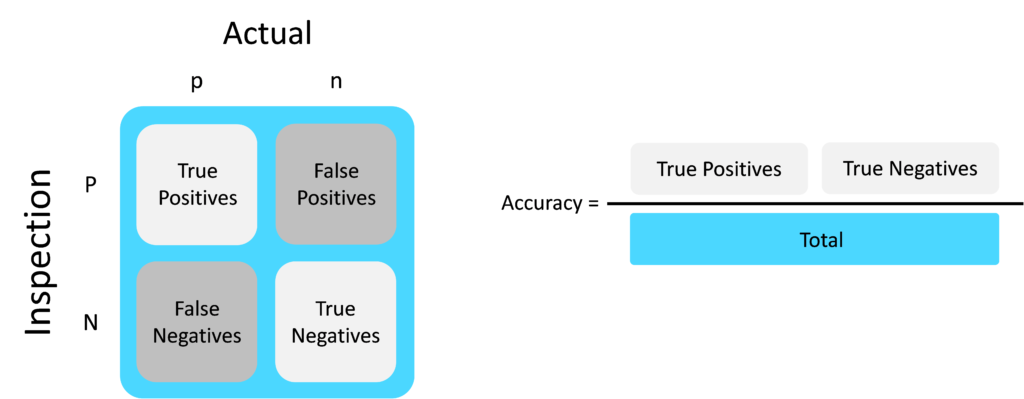
The confusion matrix is a powerful tool for visualizing inspection system decision outcomes. The actual state of a product under inspection is denoted by ‘p’ and ‘n’ (see figure below). The presence of a real defect is indicated by ‘p’ for positive. The result of the inspection is denoted by ‘P’ and ‘N’ – a detected defect is indicated by ‘P’. For a simple good / bad inspection system (a binary classifier), there are four boxes in the confusion matrix. The True Positives and True Negatives represent the inspection system correctly detecting the true state of the object under inspection. False Positives refer to the inspection system falsely detecting a defect which is not actually present. False Negatives are when the inspection system fails to identify a real defect. Inspection system accuracy is therefore calculated as the number of True Positives and True Negatives divided by the total.
The issue with accuracy
When training and evaluating an inspection system classifier, we typically have a small number of defective samples and a plentiful supply of defect-free samples. This type of skewed data set can lead us to take poor decisions when developing the inspection system.
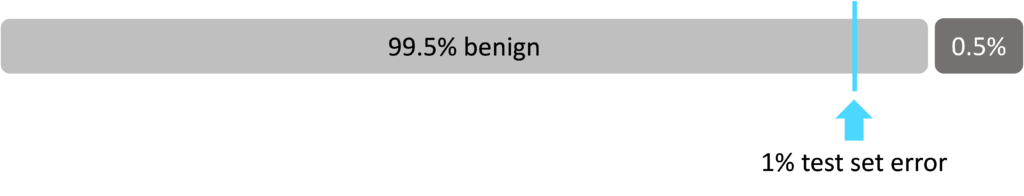
Consider a medical inspection device which classifies tumors as cancerous or benign. The inspection system is evaluated to be 99% accurate using a testing data set i.e. it incorrectly classifies a tumor 1% of the time. If the data set used to develop and evaluate the inspection system is heavily skewed, for example if only 0.5% of the training data and test data patients have cancer, an inspection system which always predicts benign would appear to perform better than an inspection system with an accuracy of 99%. This type of classifier, one which always gives the same decision output regardless of the input, is known as a 100% classifier.
This situation can lead inspection system developers to tweak a classifier during development and testing, thinking they are improving it, but actually moving it towards a 100% classifier. The heavily skewed training and test data give the false impression that higher accuracy scores are being achieved when the reality is that a 100% classifier is at work. A system which is unknowingly trained as a 100% classifier could have disastrous results when deployed into a real-life scenario.
A more accurate way of measuring accuracy
To address the issue described above, of unknowingly developing a 100% classifier, two additional evaluation metrics can be adopted: precision and recall.
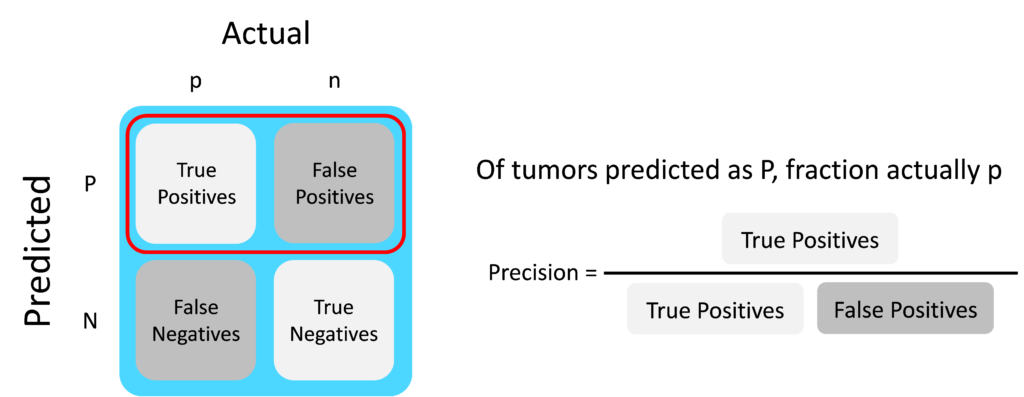
Precision examines the ratio of the true positives and the false positives i.e. of the patients predicted as having cancer, the fraction which actually have cancer.
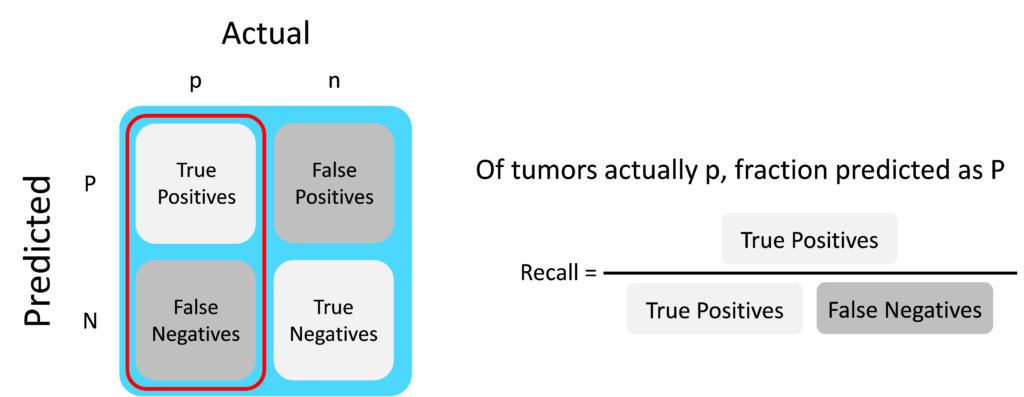
Recall examines the ratio of the true positives to the false negatives i.e of all the patients that have cancer, the fraction correctly detected as having cancer.
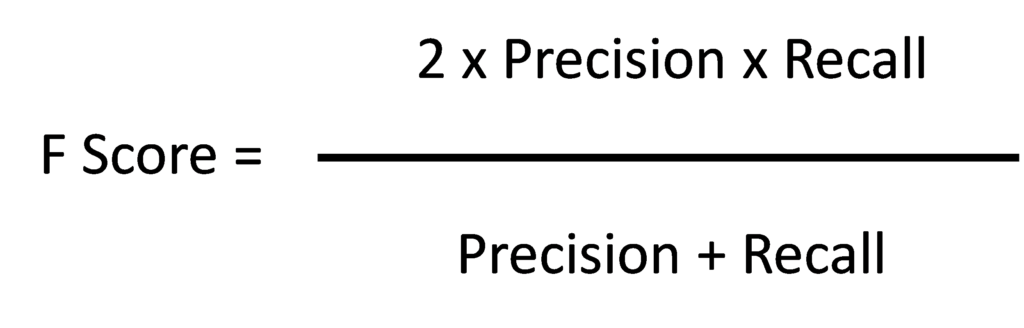
By introducing these two additional metrics, we make it impossible for a classifier to just predict P or N all the time and score well under evaluation. Classifying all tumors as benign would have zero recall. When using precision and recall to evaluate classifiers, taking a simple average of both values is not considered a good approach. Taking the F Score gives a better measure as both precision and recall need to be large in order to have a good F Score.
Conclusion
When using heavily skewed data sets, using simple accuracy as an evaluation metric can lead us to unknowingly develop a 100% classifier. Precision and Recall offer additional metrics to counter this issue, both of which can be combined into the F Score to give a balanced metric.